|
ME 405
|


|
|
ME 405
|
|
During the first week of the term project I also spent some time learning to implement and test digital filtering. I found a few online resources that discussed the theory and implemetation of digital filtering, and a python library that implements finite impulse response (FIR) filtering using a custom inline assembler. I decided to use the prebuilt FIR tool because it was written using code that operates much faster than the python that I could have written to create a FIR filter. Since all of the drivers and control code that will come together to complete the term project will likely stack up to impose a restriction on how fast the system can run, I felt that designing for speed wherever possible was important.
I tested out a few different FIR filters using a simple script that streams CSV data over USB to my PC. This script, in combination with a tool called Serial Oscilloscope, allowed me to compare raw data to averaging and FIR low pass filtering. Initially my filter design efforts were challenged by the slow speed at which I could transmit data over UART 2. It was taking ~5000 us to send each data point, imposing a nyquist frequency limit on my LP filter around 100 Hz. After speaking with one of my instructors, I decided that it would be worth switching UARTs and increasing the baudrate. I have not had the opportunity to return to filter desing yet, but I plan to use the toolchain I create for this testing to implement FIR filters for my touch pannel data and my IMU data. I chose to hold off until I had my controller operating so that I have a better idea of my sampling frequency limits.
Once I had my system operating, I saw that the signal coming from the touch pannel was quite poor. It exhibited a large amont of noise, and frequent loss of contact resulting in incosistent position control and large incorrect velocity spikes. To correct this, I began working on a signal processing method to adress both of these problems.
I started by adding batch averaging to all of my measurements. This helped to cut down on the highest frequency loss of contact events. I configured my touch pannel driver to take 1, 5 or 10 samples based on a parameter passed to the scan() method. By doing this interally to the driver, I could eliminate unnecessary pin configuration changes that could have added a few miliseconds to run time. Batch averaging was not quite enough, so I also designed a low pass digital filter.
I measured the average run time of control cycle to be aproximately 5000 us (200 Hz). I used this as my design frequency. I implemented the filter using the library mentioned above. To come up with filter coefficents I used the online filter designer TFilter.com (http://t-filter.engineerjs.com/). I tried to keep the pass band very tight since the loss of contacct event I was trying to attenuate could occure at fairly low frequencies 15-20 Hz. To reduce the number of coefficents required, I allowed for a fairly shallow cutoff. The following image shows the gain vs frequency plot of my filter along with its parameters.
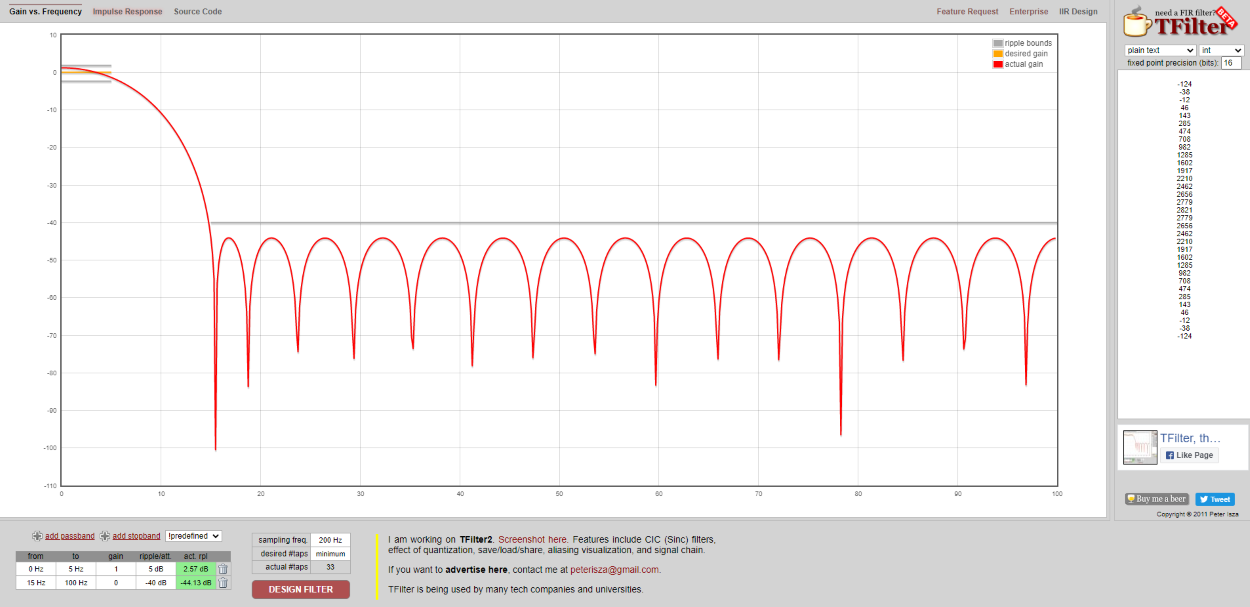
For now, I hard coded the filter coeffiecnts and scaling parameters into my touch pannel driver. If there are any issues with the magnitude of the touch pannel signal it is likely due to an issue with the scaling parameters being set for my hardware. If a new filter is deployed, new scaling values will be needed.
The filter greatly improved the quality of my signal, but it did not fully remove the effect of high frequency loss-of-contact events. For this, I added a running average based position rejection system. Essentially, I track the running average of the last 5 calls to scan(). If the most recent position values fall outside a threshold I set, the value is replaced with the average. To prevent real loss of contact events from being rejected, I update the average with the bad value. This is bad, and it directly causes some of the signal quality issues that persist in my final product. Unfortunately, I did not have the time to rework and test my rejection method for the final submittal. I believe that with a little more work this method could be improved significatly. This would fix some of the stability problems I have in my controller. It would also eliminate the need for some of the blunt workarounds I implemented in my control loop to avoid weird signal artifacts that my processing scheme created.
The following plots displays the effect of my touch pannel signal processing on raw ADC counts. To generate this response, I slid my finger along the touch pannel so that it vibrated, causing rapid loss of contact. The scope channels contain the following information:
On the top:
Green   Raw x-axis data
Purple  Raw z-axis data
Yellow  Batch sampled (n=10), FIR filtered, and mean rejected z-axis data
On the bottom:
Green   Batch sampled x-axis data  (n=10)
Purple  Batch sampled (n=10) and mean rejected x-axis data
Yellow  Batch sampled (n=10), mean rejected, and FIR filtered x-axis data
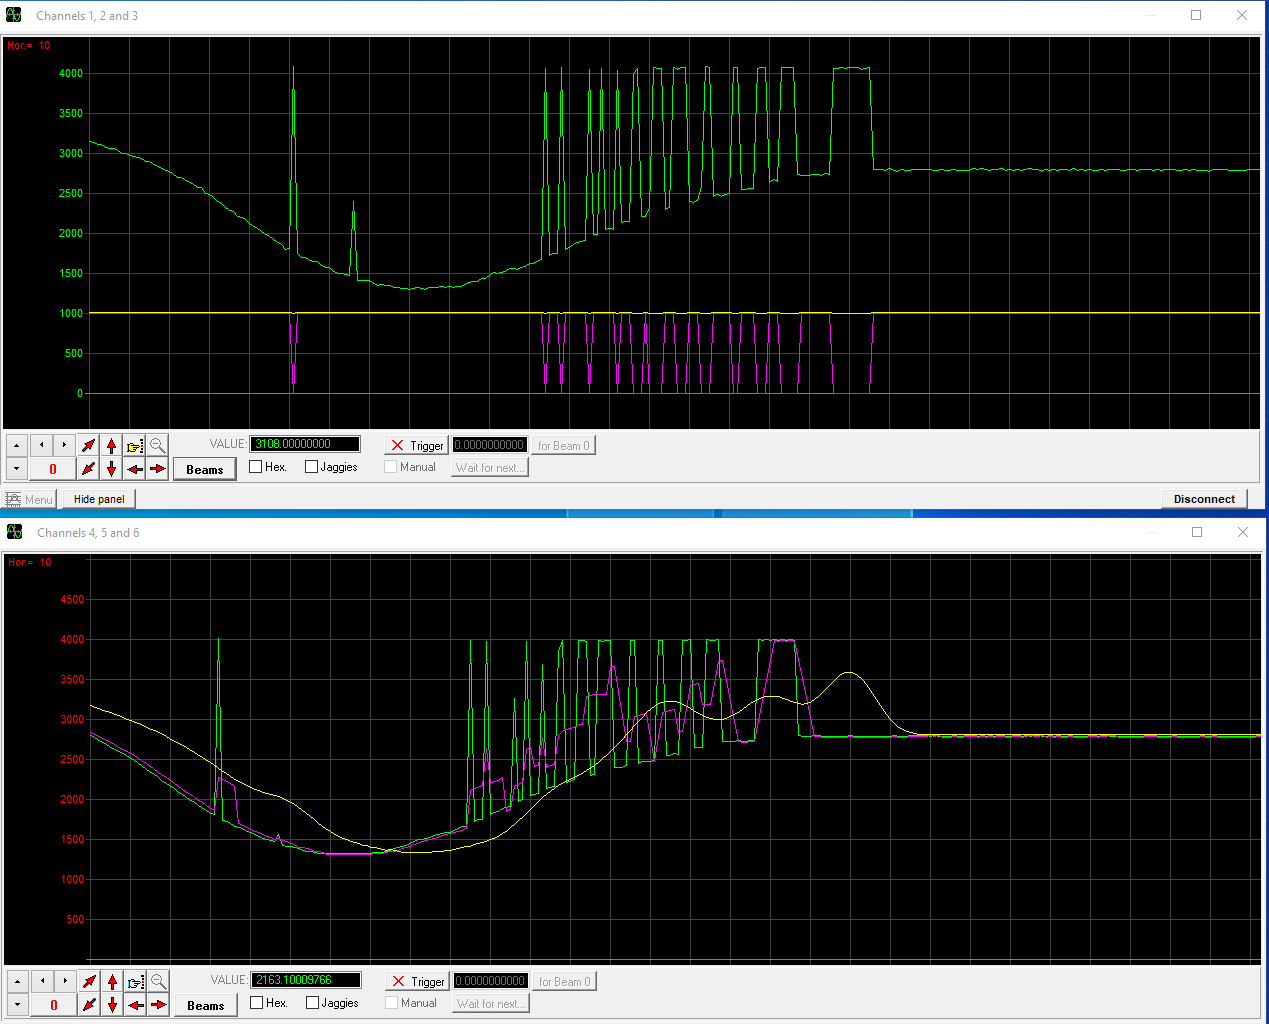
This picture highlights the fact that I am far from a qualified filter designer. Adding all of this complexity improved some aspects of my touch pannel signal while making others worse. I was able to attenuate some of the large position changes that resulted from loss of contact events (both repeated and isolated). This improvement came at the price of a clear lag in the filtered signal, and slow settling after repeated loss of contact events. With more time I am confident that I would be able to greatly improve the performance of my filter. I would start with a more robust outlier rejection method. Tuning the rejection crieteria and changing the running average would dramatically improve the quality of the data being fed to my filter. This would allow me to use a filter with far less lag.
While the final results of my plunge into filtering and signal process were lack luster, the knowledge and experience I gaines was the oposite. After this term project, I feel far more comfortable tackling a problem like this in the future. I have a much clearer view of where issues could exist, and I know how to deploy open source tools to handle desing and implementaion of digital filtering.
The following are links to the python test script that I created, and the github repo containing the FIR and averaging libraries: